
Tip
See our video guides for quick tutorials that walk you through Sigmacalx basic functionalities and concepts. This is the easiest and quickest way to get going with Sigmacalx forms.
Three different design templates are considered in this section when calculating the strength of the shear device. All of them provide the capability to input your desired ratio coefficient of the Maximum Theory.
These design templates are:
Differential pressure is translated into piston force to shear the ring over the full diameter.
Differential pressure arises from the varying diameters of the piston (sleeve), causing it to move toward the larger cross-sectional area through the sealing solution. In the present design template that movement is stopped by the complete ring between the piston and the housing.
A 3D example of the ring for a particular design template is presented in Figure 36
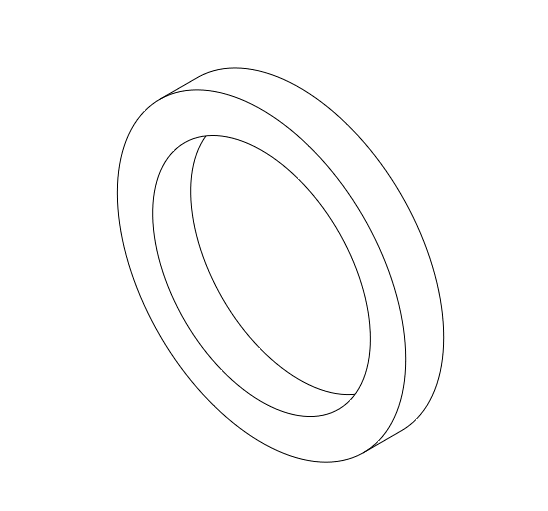
Figure 36: 3D illustration of the ring used in the present calculation tab
When you navigate to the "Force to shear full ring" page, you will come across a button: These button allows you to include up to 20 distinct test cell specifications. By incorporating multiple scenarios into the plot, you can conveniently compare them to one another, enabling the observation of boundaries and safe regions. An example illustrating this can be seen in Figure 37.
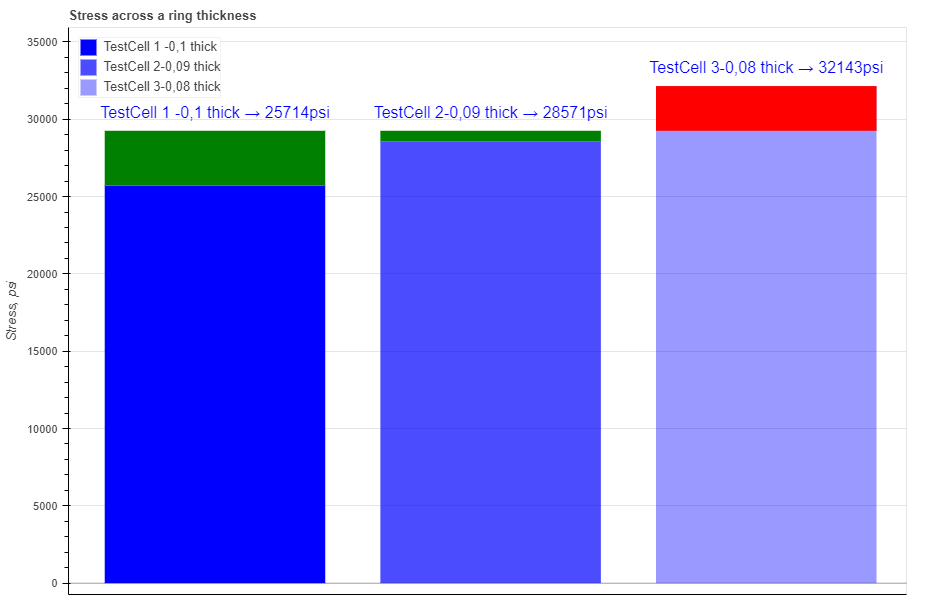
Figure 37: Three different scenarios are presented showing a visual comparison between each of them. Color on top of each bar, green or red, indicates if the scenario is above or below the safety factor.
Hovering your cursor over any of these bars reveals headers specific to each pipe. The description labeled "Safety Factor" indicates the extent by which the ring can handle a specific load in a particular load scenario, whether above or below the load's capacity. The description labeled "Generated Force" indicates the piston force due to pressure differential and the description labeled "Max Stress" indicates the maximum stress value across the ring thickness.
In the test cell section all fields are required to be filled in:
When you fill in all parameters, press button. It is also a good practice to give a specific name for the pipe, for example: "Test Cell - IP 5ksi". This name will be shown on the generated report and on the selection menu in the load section.
You can customize each bar on the plot by changing the specific parameters under button. Here you can choose a color, opacity and show the label for each pipe. For each form you can choose to show or hide safety factor color that is added on top of each bar.
After you enter the required data for your analysis you can generate the report by pressing button. There you can fill the Project Name, Document Number, Created by and your Company Logo. You can also leave those fields blank and our company logo will be set on the report. To download the report you need to press button again. At the bottom of the export pop-up window you will find two html links. The first link is to download the report in PDF format and the other link is to download HTML plot, that might be useful to observe if you have high density data.
Below you may watch a short video tutorial of how to use the forms of this particular calculation.
Video: 21 Force to shear full ring
Differential pressure is translated into piston force to shear the ring with cutouts over the full diameter, as illustrated in the Figure 38
Differential pressure arises from the varying diameters of the piston (sleeve), causing it to move toward the larger cross-sectional area through the sealing solution. In the present design template that movement is stopped by the ring with cutouts between the piston and the housing.
A 3D example of the ring for a particular design template is presented in Figure 38
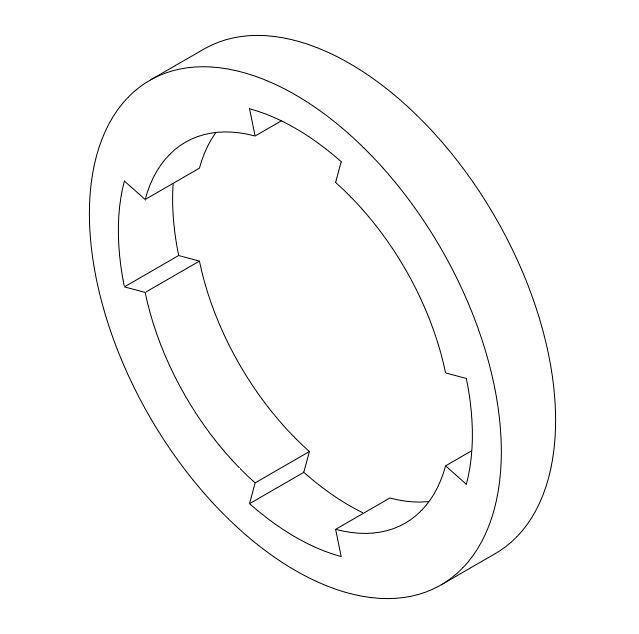
Figure 38: 3D illustration of the ring used in the present calculation tab
When you navigate to the "Force to shear ring with segments" page, you will come across a button: These button allows you to include up to 20 distinct test cell specifications. By incorporating multiple scenarios into the plot, you can conveniently compare them to one another, enabling the observation of boundaries and safe regions. An example illustrating this can be seen in Figure 39.
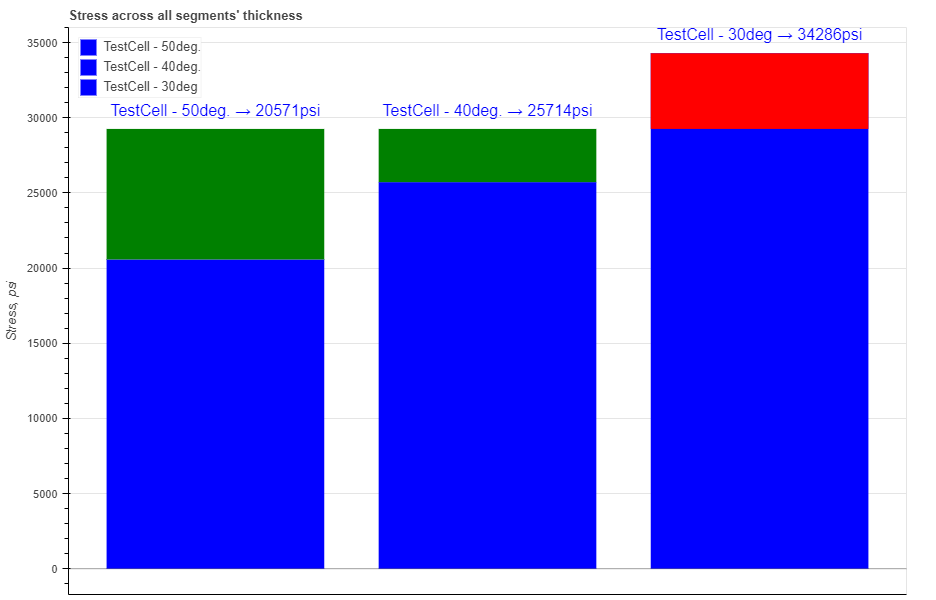
Figure 39: Three different scenarios are presented showing a visual comparison between each of them. Color on top of each bar, green or red, indicates if the scenario is above or below the safety factor.
Hovering your cursor over any of these bars reveals headers specific to each pipe. The description labeled "Safety Factor" indicates the extent by which the ring can handle a specific load in a particular load scenario, whether above or below the load's capacity. The description labeled "Generated Force" indicates the piston force due to pressure differential and the description labeled "Max Stress" indicates the maximum stress value across the ring thickness.
In the test cell section all fields are required to be filled in:
When you fill in all parameters, press button. It is also a good practice to give a specific name for the pipe, for example: "Test Cell - IP 5ksi". This name will be shown on the generated report and on the selection menu in the load section.
You can customize each bar on the plot by changing the specific parameters under button. Here you can choose a color, opacity and show the label for each pipe. For each form you can choose to show or hide safety factor color that is added on top of each bar.
After you enter the required data for your analysis you can generate the report by pressing button. There you can fill the Project Name, Document Number, Created by and your Company Logo. You can also leave those fields blank and our company logo will be set on the report. To download the report you need to press button again. At the bottom of the export pop-up window you will find two html links. The first link is to download the report in PDF format and the other link is to download HTML plot, that might be useful to observe if you have high density data.
Below you may watch a short video tutorial of how to use the forms of this particular calculation.
Video: 21 Force to shear ring with segments
Differential pressure is translated into piston force to shear the pins, screws installed equally over the full diameter, as illustrated in the Figure 40
Differential pressure arises from the varying diameters of the piston (sleeve), causing it to move toward the larger cross-sectional area through the sealing solution. In the present design template that movement is stopped by the number of shear pins (screws) installed between the piston and the housing.
A 3D example of the 4 pins installed equally over 90deg for a particular design template is presented in Figure 40
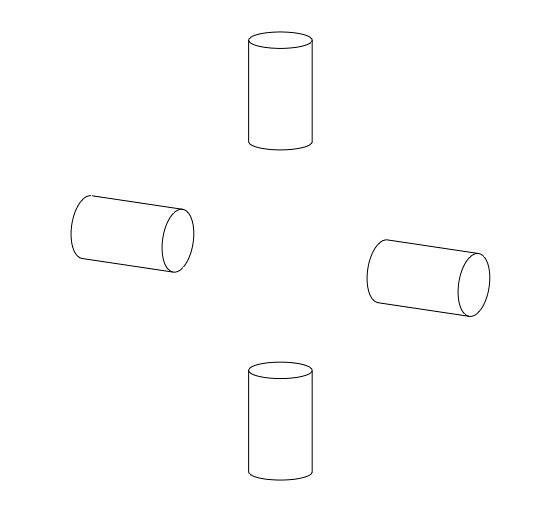
Figure 40: 3D illustration of the 4 pins installed equally over 90deg used in the present calculation tab
When you navigate to the "Force to shear pins" page, you will come across a button: These button allows you to include up to 20 distinct test cell specifications. By incorporating multiple scenarios into the plot, you can conveniently compare them to one another, enabling the observation of boundaries and safe regions. An example illustrating this can be seen in Figure 41.
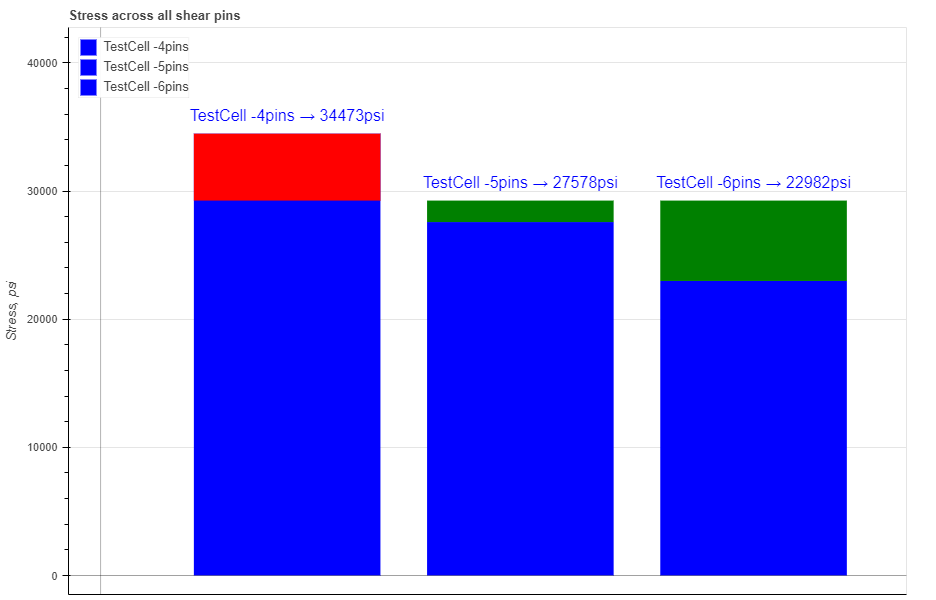
Figure 41: Three different scenarios are presented showing a visual comparison between each of them. Color on top of each bar, green or red, indicates if the scenario is above or below the safety factor.
Hovering your cursor over any of these bars reveals headers specific to each pipe. The description labeled "Safety Factor" indicates the extent by which the ring can handle a specific load in a particular load scenario, whether above or below the load's capacity. The description labeled "Generated Force" indicates the piston force due to pressure differential and the description labeled "Max Stress" indicates the maximum stress value across total cross-section of all pins.
In the test cell section all fields are required to be filled in:
When you fill in all parameters, press button. It is also a good practice to give a specific name for the pipe, for example: "Test Cell - IP 5ksi". This name will be shown on the generated report and on the selection menu in the load section.
You can customize each bar on the plot by changing the specific parameters under button. Here you can choose a color, opacity and show the label for each pipe. For each form you can choose to show or hide safety factor color that is added on top of each bar.
After you enter the required data for your analysis you can generate the report by pressing button. There you can fill the Project Name, Document Number, Created by and your Company Logo. You can also leave those fields blank and our company logo will be set on the report. To download the report you need to press button again. At the bottom of the export pop-up window you will find two html links. The first link is to download the report in PDF format and the other link is to download HTML plot, that might be useful to observe if you have high density data.
Below you may watch a short video tutorial of how to use the forms of this particular calculation.
Video: 22 Force to shear pins