
Tip
See our video guides for quick tutorials that walk you through Sigmacalx basic functionalities and concepts. This is the easiest and quickest way to get going with Sigmacalx forms.
In this section, we have developed generators to construct various types of material curves.
All the formulas and equations used to create these generators were sourced from ASME BPVC VIII.2-2019.
These types of material curves are:
Model of the stress-strain curve is considering the strain hardening characteristics with input values at specified temperature.
Calculations are based on ANNEX 3-D from ASME BPVC VIII.2-2019.
A stress-strain curve defines how a material behaves under load, which provides insights into the material’s strength, stiffness, ductility, and failure limits.
When you navigate to the "Stress-Strain Curves" page, you will come across a button: These button allows you to include up to 20 distinct materials. By incorporating multiple scenarios into the plot, you can conveniently compare them to one another, enabling the observation maximum elastic limits, yield strength and UTS. An example illustrating this can be seen in Figure 51.
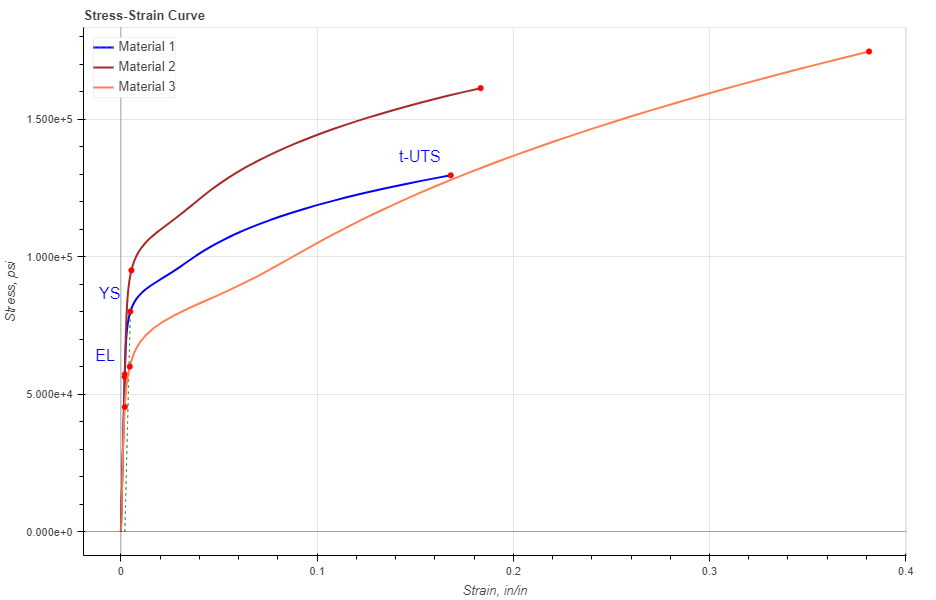
Figure 51: Three different materials are presented showing a visual comparison between each of them.
In the material data section all fields are required to be filled in:
When you fill in all parameters, press button. It is also a good practice to give a specific name for the Material, for example: "UNS S41000". This name will be shown on the generated report and on the selection menu in the load section.
You can customize each curve on the plot by changing the specific parameters under button. Here you can choose a color, opacity and show the label for each point. For each form you can choose to show or hide offset line, a line drawn parallel to the linear part of a stress-strain curve, but displaced to the right by 0.2% strain.
After you enter the required data for your analysis you can generate the report by pressing button. There you can fill the Project Name, Document Number, Created by and your Company Logo. You can also leave those fields blank and our company logo will be set on the report. To download the report you need to press button again. At the bottom of the export pop-up window you will find two html links. The first link is to download the report in PDF format and the other link is to download HTML plot, that might be useful to observe if you have high density data.
Below you may watch a short video tutorial of how to use the forms of this particular calculation.
Video: 26 Stress-Strain Curves
Smooth bar design fatigue curves for different materials with the known stress amplitude. The fatigue curves and associated equations are used for different materials.
Calculations are based on ANNEX 3-F from ASME BPVC VIII.2-2019.
The fatigue curve describes the relation between cyclic stress amplitude and number of cycles to failure
When you navigate to the "Fatigue Curves" page, you will come across a button: These button allows you to include up to 20 distinct materials. By incorporating multiple scenarios into the plot, you can conveniently compare them to one another. An example illustrating this can be seen in Figure 52.
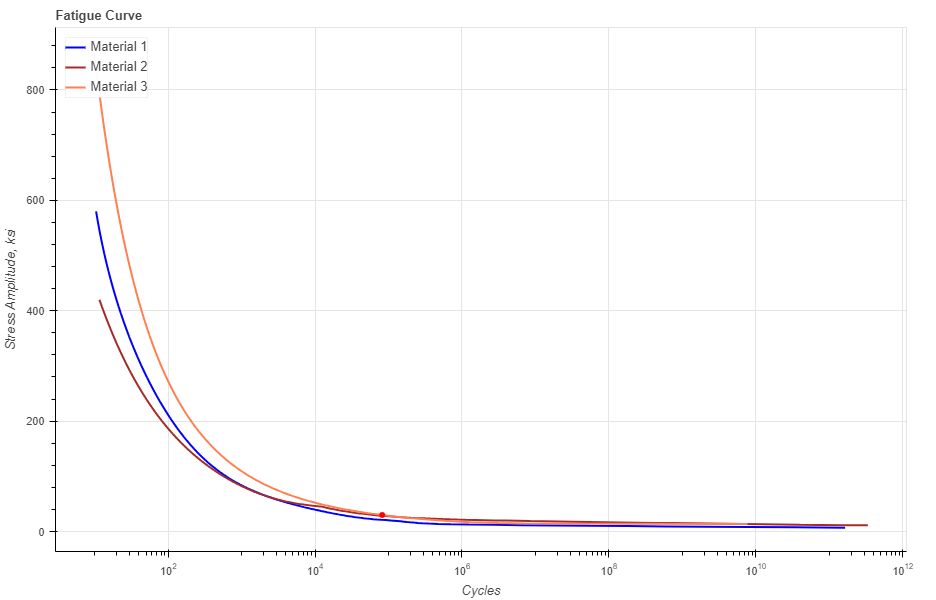
Figure 52: Three different materials are presented showing a visual comparison between each of them.
In the material data section all fields are required to be filled in:
When you fill in all parameters, press button. It is also a good practice to give a specific name for the Material, for example: "UNS S41000". This name will be shown on the generated report and on the selection menu in the load section.
You can customize each curve on the plot by changing the specific parameters under button. Here you can choose a color, width and type of the curve. For each form you can choose to show or hide SA (Stress Amplitude), a point on the curve showing the exact number of available cycles with respect to your stress amplitude value.
After you enter the required data for your analysis you can generate the report by pressing button. There you can fill the Project Name, Document Number, Created by and your Company Logo. You can also leave those fields blank and our company logo will be set on the report. To download the report you need to press button again. At the bottom of the export pop-up window you will find two html links. The first link is to download the report in PDF format and the other link is to download HTML plot, that might be useful to observe if you have high density data.
Below you may watch a short video tutorial of how to use the forms of this particular calculation.
Video: 27 Fatigue Curves
The contents or rules described in this calculation form is used to determine if a fatigue analysis is required as part of the vessel design. The following method can only be used for materials a specified minimum tensile strength that is less than or equal to 552MPa (80000psi).
Calculations are based on 5.5.2.3 from ASME BPVC VIII.2-2019.
When you navigate to the "Fatigue Analysis Screening, Method A" page, you will come across a button: These button allows you to include up to 5 distinct materials. By incorporating multiple scenarios into the plot, you can conveniently compare them to one another. An example illustrating this can be seen in Figure 53.
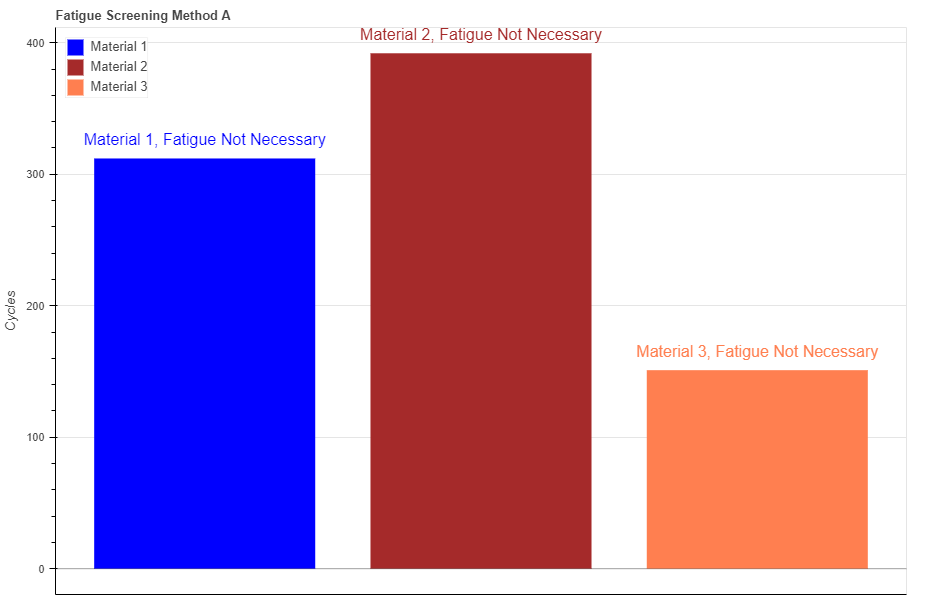
Figure 53: Three different materials are presented showing a visual comparison between each of them.
In the material data section all fields are required to be filled in:

Figure 54: The graphical illustration of the difference between NΔFP and NΔPO.
When you fill in all parameters, press button. It is also a good practice to give a specific name for the Material, for example: "UNS S41000". This name will be shown on the generated report and on the selection menu in the load section.
You can customize each curve on the plot by changing the specific parameters under button. Here you can choose a color, and opacity of the bar. For each form you can choose to show or hide labels showing material name and results if fatigue is need or not.
Hovering your cursor over any of these bars reveals headers specific to each material. The description labeled "Total Cycles" indicates the maximum calculated cycling operating loads for a specific material. The description labeled "Cycles Limit" indicates the limit cycling operating loads for a specific material. To avoid running the full fatigue analysis, the "Total Cycles" must be less than the "Cycles Limit."
After you enter the required data for your analysis you can generate the report by pressing button. There you can fill the Project Name, Document Number, Created by and your Company Logo. You can also leave those fields blank and our company logo will be set on the report. To download the report you need to press button again. At the bottom of the export pop-up window you will find two html links. The first link is to download the report in PDF format and the other link is to download HTML plot, that might be useful to observe if you have high density data.
Below you may watch a short video tutorial of how to use the forms of this particular calculation.
Video: 28 Fatigue Analysis Screening, Method A
The contents or rules described in this calculation form is used to determine if a fatigue analysis is required as part of the vessel design. The following method can be used for all materials.
Calculations are based on 5.5.2.4 from ASME BPVC VIII.2-2019.
When you navigate to the "Fatigue Analysis Screening, Method B" page, you will come across a button: These button allows you to include up to 5 distinct materials. By incorporating multiple scenarios into the plot, you can conveniently compare them to one another. An example illustrating this can be seen in Figure 55.
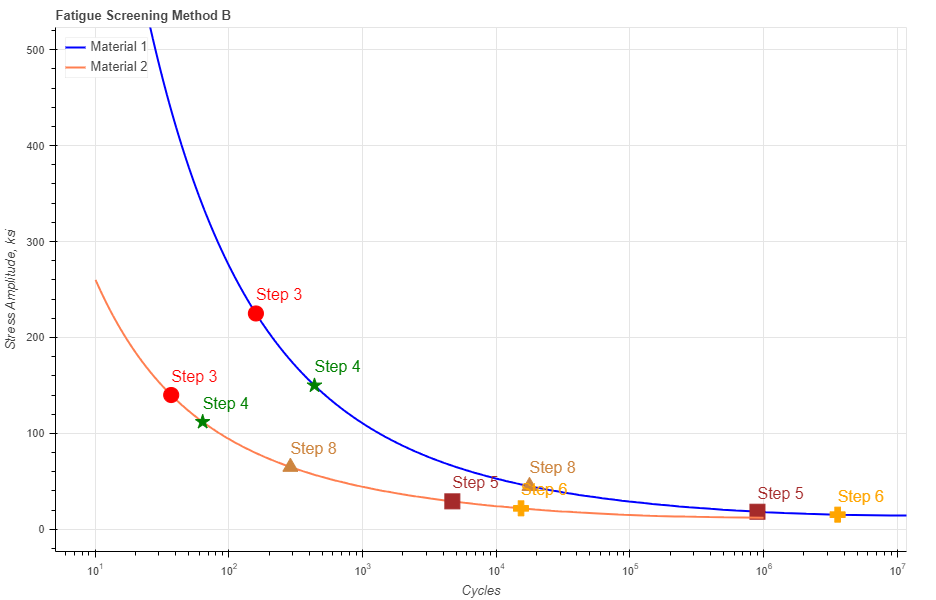
Figure 55: Two different materials are presented showing a visual comparison between each of them.
In the material data section all fields are required to be filled in:
When you fill in all parameters, press button. It is also a good practice to give a specific name for the Material, for example: "UNS S41000". This name will be shown on the generated report and on the selection menu in the load section.
You can customize each curve on the plot by changing the specific parameters under button. Here you can choose a color, width and type of the curve. For each form you can choose to show or hide labels corresponding to each step based on ASME procedure.
Hovering your cursor over any of these bars reveals headers specific to each material. The description labeled "Total Cycles" indicates the maximum calculated cycling operating loads for a specific material. The description labeled "Cycles Limit" indicates the limit cycling operating loads for a specific material. To avoid running the full fatigue analysis, the "Total Cycles" must be less than the "Cycles Limit."
After you enter the required data for your analysis you can generate the report by pressing button. There you can fill the Project Name, Document Number, Created by and your Company Logo. You can also leave those fields blank and our company logo will be set on the report. To download the report you need to press button again. At the bottom of the export pop-up window you will find two html links. The first link is to download the report in PDF format and the other link is to download HTML plot, that might be useful to observe if you have high density data.
Below you may watch a short video tutorial of how to use the forms of this particular calculation.
Video: 29 Fatigue Analysis Screening, Method B