
Tip
See our video guides for quick tutorials that walk you through Sigmacalx basic functionalities and concepts. This is the easiest and quickest way to get going with Sigmacalx forms.
Three different material properties are considered in this section when calculating the de-rating ratio due to an increase in temperature.
Calculations are based on ASME BPVC.II.D.C-2021
These properties are:
Model of the de-rating young's modulus property of a material due to evaluated temperature.
When you navigate to the "Young's Modulus de-rating" page, you will come across a button: These button allows you to include up to 6 distinct material de-rating curves. By incorporating multiple scenarios into the plot, you can conveniently compare them to one another, enabling the observation of boundaries and safe regions. An example illustrating this can be seen in Figure 56.
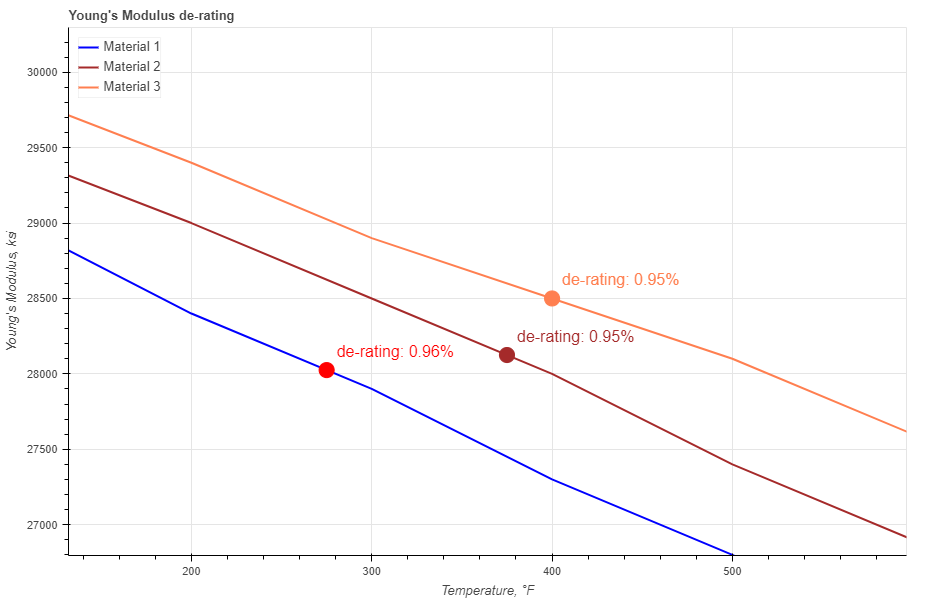
Figure 56: Three different curves are presented showing de-faring ratio for each material and temperature.
In the material data section all fields are required to be filled in:
When you fill in all parameters, press button. It is also a good practice to give a specific name for the Material, for example: "UNS S41000". This name will be shown on the generated report and on the selection menu in the load section.
You can customize each curve on the plot by changing the specific parameters under button. Here you can choose a color, width and type of the curve. For each form you can choose to show or hide de-rating vertex and the label for it.
After you enter the required data for your analysis you can generate the report by pressing button. There you can fill the Project Name, Document Number, Created by and your Company Logo. You can also leave those fields blank and our company logo will be set on the report. To download the report you need to press button again. At the bottom of the export pop-up window you will find two html links. The first link is to download the report in PDF format and the other link is to download HTML plot, that might be useful to observe if you have high density data.
Below you may watch a short video tutorial of how to use the forms of this particular calculation.
Video: 30 Young's Modulus de-rating
Model of the de-rating yield strength property of a material due to evaluated temperature.
When you navigate to the "Yield Strength de-rating" page, you will come across a button: These button allows you to include up to 6 distinct material de-rating curves. By incorporating multiple scenarios into the plot, you can conveniently compare them to one another, enabling the observation of boundaries and safe regions. An example illustrating this can be seen in Figure 57.
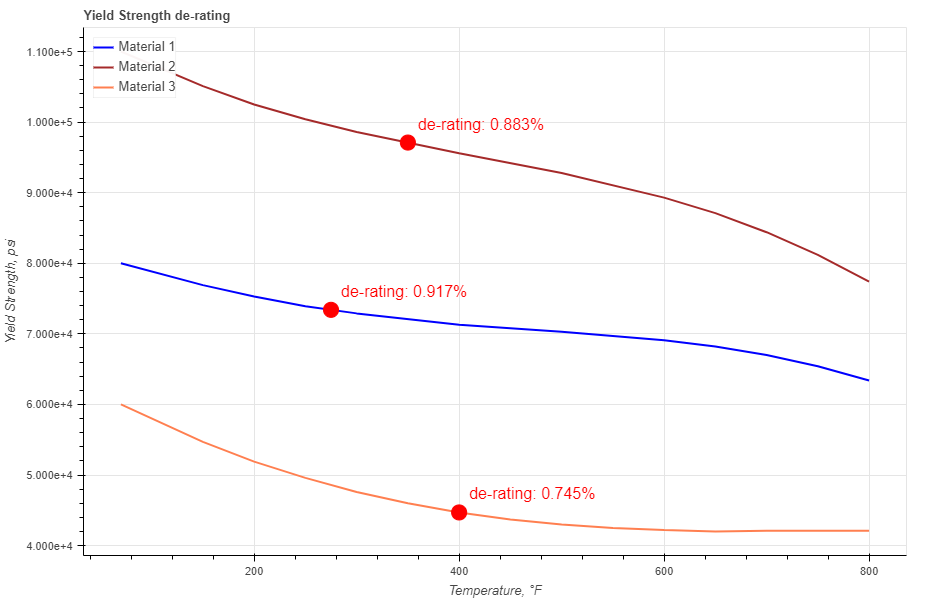
Figure 57: Three different curves are presented showing de-faring ratio for each material and temperature.
In the material data section all fields are required to be filled in:
When you fill in all parameters, press button. It is also a good practice to give a specific name for the Material, for example: "UNS S41000". This name will be shown on the generated report and on the selection menu in the load section.
You can customize each curve on the plot by changing the specific parameters under button. Here you can choose a color, width and type of the curve. For each form you can choose to show or hide de-rating vertex and the label for it.
After you enter the required data for your analysis you can generate the report by pressing button. There you can fill the Project Name, Document Number, Created by and your Company Logo. You can also leave those fields blank and our company logo will be set on the report. To download the report you need to press button again. At the bottom of the export pop-up window you will find two html links. The first link is to download the report in PDF format and the other link is to download HTML plot, that might be useful to observe if you have high density data.
Below you may watch a short video tutorial of how to use the forms of this particular calculation.
Video: 31 Yield Strength de-rating
Model of the de-rating ultimate tensile strength property of a material due to evaluated temperature.
When you navigate to the "Ultimate Tensile Strength de-rating" page, you will come across a button: These button allows you to include up to 6 distinct material de-rating curves. By incorporating multiple scenarios into the plot, you can conveniently compare them to one another, enabling the observation of boundaries and safe regions. An example illustrating this can be seen in Figure 58.
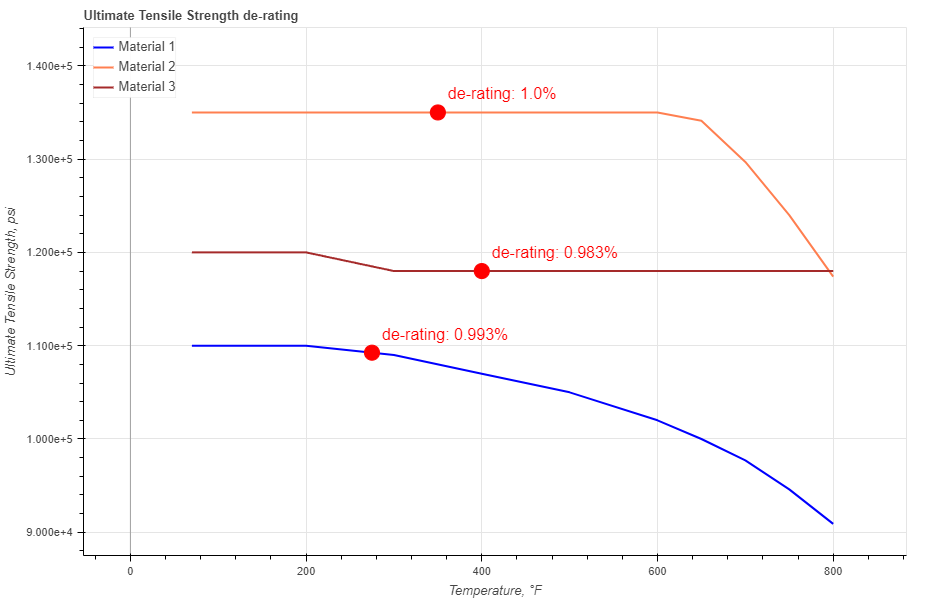
Figure 58: Three different curves are presented showing de-faring ratio for each material and temperature.
In the material data section all fields are required to be filled in:
When you fill in all parameters, press button. It is also a good practice to give a specific name for the Material, for example: "UNS S41000". This name will be shown on the generated report and on the selection menu in the load section.
You can customize each curve on the plot by changing the specific parameters under button. Here you can choose a color, width and type of the curve. For each form you can choose to show or hide de-rating vertex and the label for it.
After you enter the required data for your analysis you can generate the report by pressing button. There you can fill the Project Name, Document Number, Created by and your Company Logo. You can also leave those fields blank and our company logo will be set on the report. To download the report you need to press button again. At the bottom of the export pop-up window you will find two html links. The first link is to download the report in PDF format and the other link is to download HTML plot, that might be useful to observe if you have high density data.
Below you may watch a short video tutorial of how to use the forms of this particular calculation.
Video: 31 Ultimate Tensile Strength de-rating