
Tip
See our video guides for quick tutorials that walk you through Sigmacalx basic functionalities and concepts. This is the easiest and quickest way to get going with Sigmacalx forms.
Three pipe stresses that can be imposed on an object with a cylindrical shape are as follows:
Formulas to calculate those stresses are taken from API 5C3 standard (A.1.2.3/4/5), and are valid for "thick-walled" pressure vessels with their wall thickness greater than one-tenth of the overall diameter.
The gravitational force field, along with other environmental loads give rise to an axial force. The resulting axial stress, i.e. the component of the axial stress not due to bending, assumed uniform across any cross-section.
When you navigate to the "Uniform Axial Stress" page, you will come across two buttons: and These buttons allow you to include up to 5 distinct pipe specifications and up to 20 different load cases. By incorporating multiple pipes and load cases into the plot, you can conveniently compare them to one another, enabling the observation of boundaries and safe regions. An example illustrating this can be seen in Figure 13.
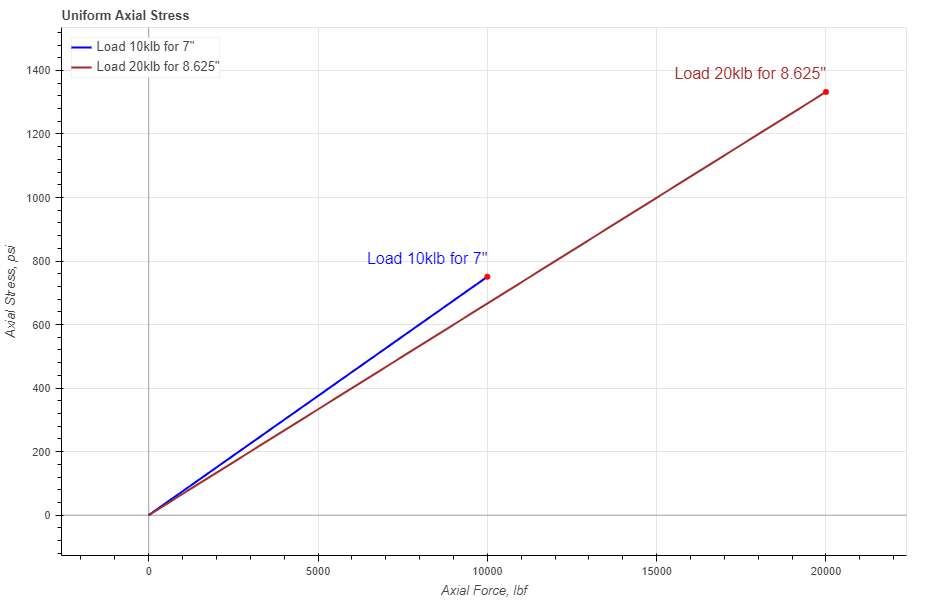
Figure 13: Two axial stresses are presented, representing the stress distribution depending on the axial load of two tubing sizes.
In the pipe section you have 2 required parameters: Outside Diameter (OD) and Inside Diameter (ID)
There are 2 more optional parameters you may input on the tubing section: minimum Wall Thickness (mWT) and Corrosion Allowance (CA). Units for mWT is % and it is based on the specified manufacturing tolerance. Common number which is used for tubing and casing in the oil industry is 87,5%. Units for CA are either in or mm, depending which system you choose by pressing buttons Corrosion allowance is a measurement to the thickness of the wall. It is a metal loss throughout the lifespan of certain material in a certain conditions.
When you fill in all parameters for the pipe, press button. It is also a good practice to give a specific name for the pipe, for example: Tubing 7"-46#. This name will be shown on the generated report and on the selection menu in the load section.
Now you can specify the loading parameters for the pipe if you press button. Here you have an option to enter axial load and select the pipe you want to apply the load for.
After you fill in all magnitudes of the load case, press button. You will not see any changes on the plot until you select the specific pipe name from the list.
You can customize the load case by changing the specific parameters under button. Here you can choose a color, type and width for the stress line.
After you enter the required data for your analysis you can generate the report by pressing button. There you can fill the Project Name, Document Number, Created by and your Company Logo. You can also leave those fields blank and our company logo will be set on the report. To download the report you need to press button again. At the bottom of the export pop-up window you will find two html links. The first link is to download the report in PDF format and the other link is to download HTML plot, that might be useful to observe if you have high density data.
Below you may watch a short video tutorial of how to use the forms of this particular calculation.
Video: 7 Uniform Axial Stress manual
The axial stress component due to solely to bending
The component of axial stress due to bending can be positive (tension) or negative (compression), depending on the location of the point in the cross section. Points in the pipe cross section closer to the center of tube curvature than the centreline of the pipe experience compressive bending stress. Points in the pipe cross section father from the centre of tube curvature than the centreline of the pipe experience tensile bending stress.
When you navigate to the "Bending Stress" page, you will come across two buttons: and These buttons allow you to include up to 5 distinct pipe specifications and up to 20 different load cases. By incorporating multiple pipes and load cases into the plot, you can conveniently compare them to one another, enabling the observation of boundaries and safe regions. An example illustrating this can be seen in Figure 14.
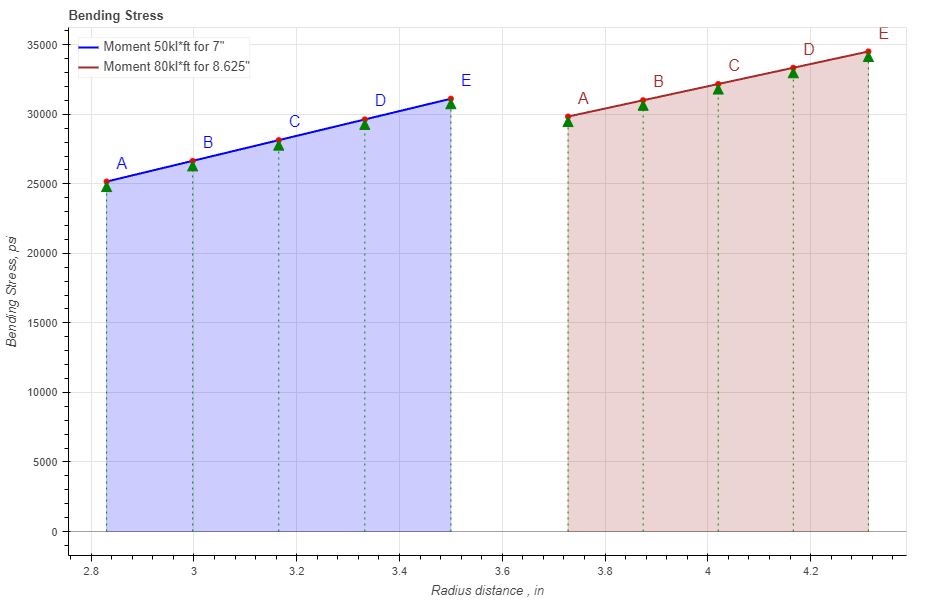
Figure 14: Two bending stress curves are presented, representing the stress distribution across the wall of two tubing sizes exposed to varying moment loads.
For enhanced comprehension of the stress distribution throughout the thickness, you have the option to simultaneously exhibit the radial cross-section of the pipe alongside a bending stress curve.
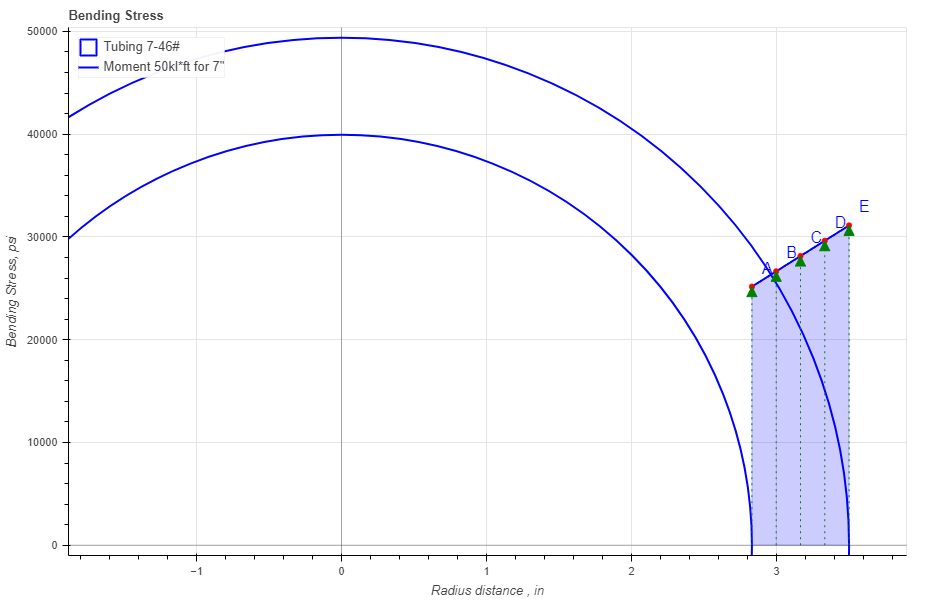
Figure 15: Bending stress curve with a specified pipe, representing the stress distribution across the wall of a particular tubing size exposed to the moment load.
In the pipe section you have 2 required parameters: Outside Diameter (OD) and Inside Diameter (ID)
There are 2 more optional parameters you may input on the tubing section: minimum Wall Thickness (mWT) and Corrosion Allowance (CA). Units for mWT is % and it is based on the specified manufacturing tolerance. Common number which is used for tubing and casing in the oil industry is 87,5%. Units for CA are either in or mm, depending which system you choose by pressing buttons Corrosion allowance is a measurement to the thickness of the wall. It is a metal loss throughout the lifespan of certain material in a certain conditions.
When pipe cross-section is added on the plot you can modify it by changing the color of the curve, line width and etc. You can also fill the cross-section area with a color and modify it as you like.
When you fill in all parameters for the pipe, press button. It is also a good practice to give a specific name for the pipe, for example: Tubing 7"-46#. This name will be shown on the generated report and on the selection menu in the load section.
Now you can specify the loading parameters for the pipe if you press button. Here you have an option to "Select Input", right above button. We recommend to select one of those two options there first and press button. Those options are "bending moment" and "tube curvature". If you choose "bending moment" you need to enter only a moment load. If you choose "tube curvature" you need to enter more variables such as "Degree", "Y-Modulus" (Young's modulus) and "Length". The most straightforward method to create the bending stress curve is to be informed about the moment load on the pipe during bending. However, if you lack knowledge of the moment load, you must input the following variables, as depicted below.
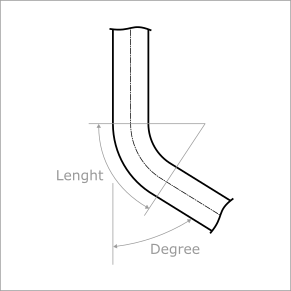
Figure 16: Description of variables.
After you fill in all magnitudes of the load case, press button. You will not see any changes on the plot until you select the specific pipe name from the list.
You can customize the load case by changing the specific parameters under button. There is one parameter that might catch your attention, POI (Point of Interest). This parameter provides you with a distinct stress value corresponding to a distance between the internal and external radii that you input into the designated field.
After you enter the required data for your analysis you can generate the report by pressing button. There you can fill the Project Name, Document Number, Created by and your Company Logo. You can also leave those fields blank and our company logo will be set on the report. To download the report you need to press button again. At the bottom of the export pop-up window you will find two html links. The first link is to download the report in PDF format and the other link is to download HTML plot, that might be useful to observe if you have high density data.
Below you may watch a short video tutorial of how to use the forms of this particular calculation.
Video: 8 Bending Stress manual
Torsion in a pipe refers to the act of twisting it when subjected to twisting moments or torques that induce rotational motion around the longitudinal axis of the pipe.
The torsional shear stress is acting in the circumferential direction on pipe cross-section.
Upon accessing the Torsional Stress page, you will encounter two buttons: and These buttons allow you to include up to 5 distinct pipe specifications and up to 20 different load cases. By incorporating multiple pipes and load cases into the plot, you can conveniently compare them to one another, enabling the observation of boundaries and safe regions. An example illustrating this can be seen in Figure 17.
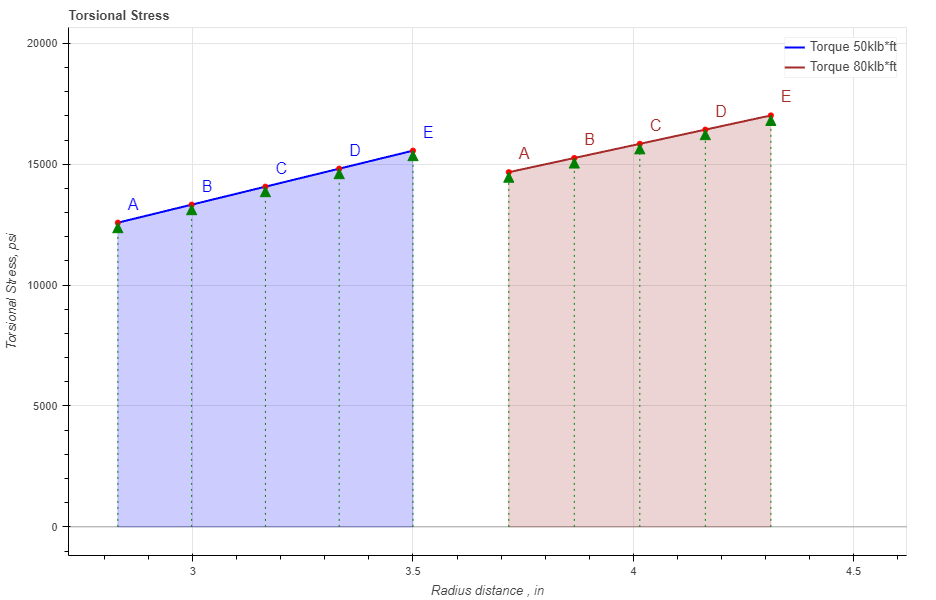
Figure 17: Two torsional stress curves are presented, representing the stress distribution across the wall of two tubing sizes exposed to varying internal pressure levels.
For enhanced comprehension of the stress distribution throughout the thickness, you have the option to simultaneously exhibit the radial cross-section of the pipe alongside a torsional stress curve.
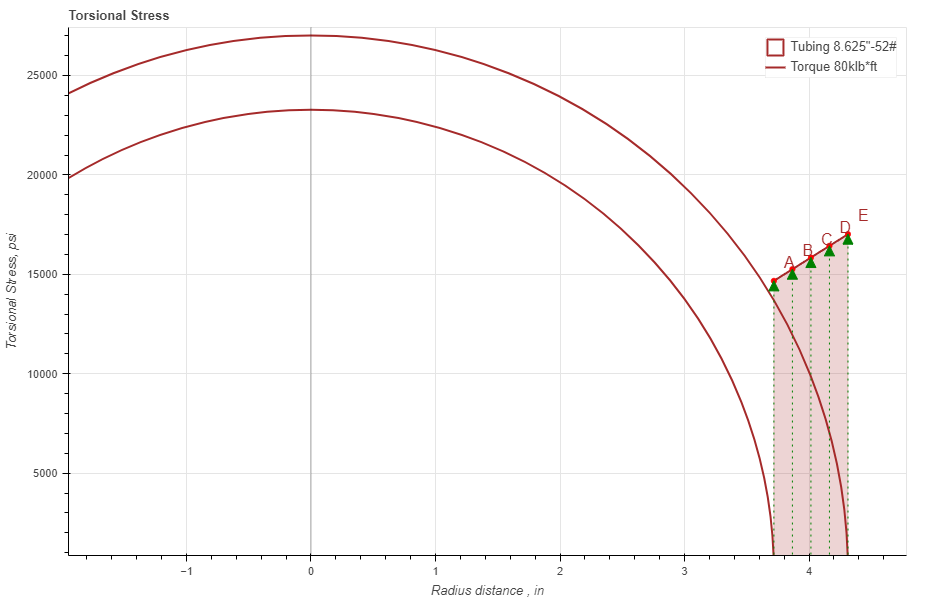
Figure 18: Torsional stress curve with a specified pipe, representing the stress distribution across the wall of a particular tubing size exposed to the torque load.
In the pipe section you have 2 required parameters: Outside Diameter (OD) and Inside Diameter (ID)
There are 2 more optional parameters you may input on the tubing section: minimum Wall Thickness (mWT) and Corrosion Allowance (CA). Units for mWT is % and it is based on the specified manufacturing tolerance. Common number which is used for tubing and casing in the oil industry is 87,5%. Units for CA are either in or mm, depending which system you choose by pressing buttons Corrosion allowance is a measurement to the thickness of the wall. It is a metal loss throughout the lifespan of certain material in a certain conditions.
When pipe cross-section is added on the plot you can modify it by changing the color of the curve, line width and etc. You can also fill the cross-section area with a color and modify it as you like.
When you fill in all parameters for the pipe, press button. It is also a good practice to give a specific name for the pipe, for example: Tubing 7"-46#. This name will be shown on the generated report and on the selection menu in the load section.
Now you can specify the loading parameters for the pipe if you press button. Here you have an option to enter a torque magnitude and select the pipe you want to apply the loads for.
After you define the torque value of the load case, press button. You will not see any changes on the plot until you select the specific pipe name from the list.
You can customize the load case by changing the specific parameters under button. There is one parameter that might catch your attention, POI (Point of Interest). This parameter provides you with a distinct stress value corresponding to a distance between the internal and external radii that you input into the designated field.
After you enter the required data for your analysis you can generate the report by pressing button. There you can fill the Project Name, Document Number, Created by and your Company Logo. You can also leave those fields blank and our company logo will be set on the report. To download the report you need to press button again. At the bottom of the export pop-up window you will find two html links. The first link is to download the report in PDF format and the other link is to download HTML plot, that might be useful to observe if you have high density data.
Below you may watch a short video tutorial of how to use the forms of this particular calculation.
Video: 9 Torsional Stress manual